“Do one thing at a time, and do well”
ML Models & Pros and Cons
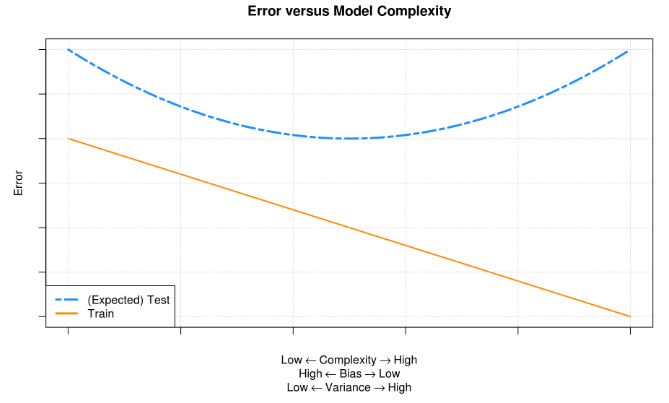
Error = bias + variance; Tradeoff

Supervised vs. unsupervised:
Supervised (regression || classification): train model with labeled y
Unsupervised (clustering): only inputs
Algorithms:
KNN (non-parametric)
KNN categorizes object based on the classes of their nearest neighbors, (distance function) in the dataset, it assumes that objects near each other are similar.
Tuning parameters: 1. Number of nearest neighbors K 2. Distance function, Euclidean
- Pros:
- Simple
- Low dimensional datasets
- Cons:
- High dimensional data might not be predicted correctly
Decision Tree
A decision tree predicts responses to data by following the decisions in the tree from its root down to leaf node. A tree consists of branching conditions where the value of a predictor is compared to a trained weight.
Tuning parameters: 1. maximum depth 2. Minimum samples in a leaf 3. Maximum numbers of leaves
Pros: 1. Easily visualized and interpreted 2. No feature normalization needed 3. Work well with a mixture of feature types
Cons: 1. Can often overfit the data 2. Usually need an ensemble trees for better performance
Random Forest: Fully grown decision tree (low bias, high variance)
- Lower variance
- Faster and better than SVM
Boosted Tree: Shallow decision tree (high bias, low variance)
- Lower bias
SVM
SVC: It classifies data by finding the decision boundary (hyperplane) that separates all data points of one class from other class by maximizing the margin between the two classes. The vectors that define the hyperplane are the support vectors. If we remove non-support vectors, it would not affect the margin. (Margin is the minimal distance from the observations to the hyperplane).
SVM It’s an extension of the support vector classifier that results from enlarging the feature space in a specific way, using kernels. (Linear, polynomial and radial kernels)
A kernel is a function that quantifies the similarity of two observations. When we use kernels, we need compute kernel functions at the n^2 inner products between training points.
Tuning parameters: 1. Kernel 2. Kernel parameters (gamma: radial) 3. Regularization parameter, C
Pros: 1. Can Perform well on a range of datasets 2. Work well for both low and high-dimensional data Cons: 1. Efficiency decreases as training set size increases 2. Needs careful normalization and parameter tuning
- SVM with linear kernel = logistic regression
- If data is not linear, use non-linear kernel
- Highly dimensional space
- High accuracy
- Avoid overfitting
- No distribution needed
- Not suffer multicollinearity
- Requires significant memory and processing power
- After 10,000 examples it starts taking too long to train
Naïve Bayes (GM)

- Pros:
- Simple
- Less data if iid
- No distribution requirement
- Good for few categories variables
- Cons:
- Multicollinearity
Gaussian Processes (use in geography)
- Infinite collection of random variables
-
Pros:
- No need to understand the data
- Powerful
****
K-means (unsupervised); (choose best K: Elbow Method)
![잎이S미0 ]0 jeqwnN](/img/gitbook/assets_interview/2%20%281%29.png)
- Pros:
- Fast
- Can detect outliers
- Cons:
- Cluster are spherical, can’t detect groups of other shape
- Multicollinearity
Lasso
- Pros:
- No distribution needed
- Variable selection
- Minimize RMSE
- Cons:
- Multicollinearity
Ridge
- Pros:
- No distribution needed
- Not suffer multicollinearity
- Minimize RMSE
- Cons:
- No variable selection
Logistic (classification)
It fits a model that can predict the probability of a binary response belonging to one class or the other.
Cost Function of Logistic Regression
The error between predicted values and observed values.
Multinom() for the response contains more than two categories
- Pros:
- Can transform non-linear features into linear by feature engineering
- Avoid noise, overfitting, and feature selection
- No distribution needed
- Easy to interpret
- No need to worry about highly correlated
- Cons:
- Multicollinearity
PCA
- Removing collinearity
- Reducing dimensions
- Use in highly correlated datasets
OVERALL:
- if the variables are normally distributed and the categorical variables all have 5+ categories: use Linear discriminant analysis
- if the correlations are mostly nonlinear: use SVM
- if sparsity and multicollinearity are a concern: Adaptive Lasso with Ridge(weights) + Lasso
General Idea
- Regression:
- Classification:
- ANOVA:
- Cluster Analysis:
- Discriminant Analysis:
- Logistics:
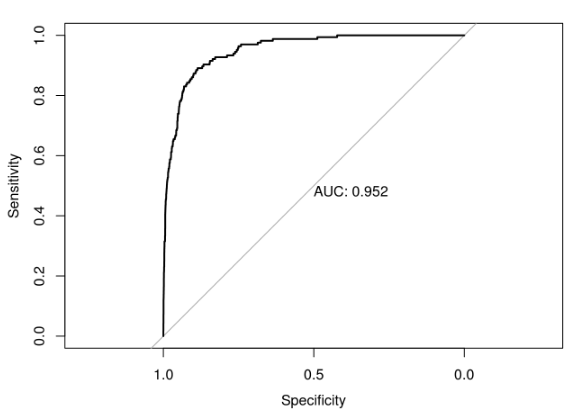
- ROC curve (Receiver Operating Characteristic curve): sweep through all possible cutoffs, and plot the sensitivity and specificity
