“Never say never, all things are possible”
Prevent Overfitting
Cross validation (refer note in part1)
Regularization
Key idea: define  s.t. we trade-off between fitting the data and keeping model simple, the regularization term penalize the magnitude of the coefficients
L1 regularization & L2 regularization
can be interpreted as MAP estimation of the parameters ridge regression need standardize variables
Don’t regularize bias term. Because otherwise the learning algorithms wouldn’t be invariant to a shift in the y- values
whitening data (subtract mean and divide by variance). For regularization, this helps all the features be penalized in the same units
https://towardsdatascience.com/regularization-in-machine-learning-76441ddcf99a
Reduce dimension
PCA (linear dimensionality reduction)
t-SNE (nonlinear dimensinality reduction)
Resampling
repeatedly drawing samples from a data set and refitting a given model on each sample with the goal of learning more about the fitted model.
Cross validation Bootstrap
Define and evaluate metrics
- regression vs. classification
Regression: MSE, MAE, WMAE, RMSLE, etc
Classification: accuracy, recall, AUC, precision, f1 score, misclassification rate, etc.
- business goal
for classification problem, if the data is unbalanced, we need to consider what type of error we care more credit card fraud: we don’t want to falsely classifed people as fraud -> low FPR
- distribution of the target variable (imbalance?)
- metric to optimize for
Example: detecting fraud - classification; want to make sure catch fraud transactions; imbalance dataset
Imbalanced dataset
Random undersampling and oversampling
Undersampling and oversampling using imbalanced-learn
imbalanced-learn( ) is a Python Package to tackle the curse of imbalanced datasets.
imblearn
Tomek links: pairs of examples of opposite classes in close vicinity. If we remove the majority element from the Tomke link, the decision boundary would be clearer
SMOTE: synthesize elements for the minority class
Class weights in the methods: specify weights for the minority class, it change the loss function Change evaluation metric: F1 score sort of maintains a balance betwee the precision and recall Other methods
Collect more data
treat the problem as anomaly detection, e.g. Isolation Forest, autoencoders Some model are particularly suited for imbalanced dataset, e.g. boosting models
Dealing w/ Outliers
i.e. how to make model robust to outliers?
data based methods:
Drop
log-scale transformation (or other time or transfromation)
Winterizing: setting the extrem values of an attribute to some specified value
Bining: dividing a list of continuous variables into groups (also leads to loss of information and loss of power)
model based methods:
Use models less impacted by outliers, e.g. tree-based methods like RF and GBM; SVM Use MAE instead of RMSE as a loss function, also can use truncated loss
https://heartbeat.fritz.ai/how-to-make-your-machine-learning-models-robust-to-outliers-44d404067d07
Compare ML lagorithm
Single dataset
Statistical significance test
Step 1: using resampling methods (e.g. k-fold cross-validation) to generate model result pairs
Step 2: use t test to check if the difference in the accuracy/f1 socre is statistically significant (however, this violated the t test assumption, becuase k-fold CV results are correlated not independent)
Ways to solve the problem: resample independent data samples; Use McNemar’s test; Use a Nonparametric Paired Test (makes few assumption, such as not assuming that the distribution of the skill scores is Gaussian.); use estimation statistics (confidence interval)
Techniques to implement feature selection
(Why feature selection? reduce overfitting, improve accuracy, reduce training time)
Filter Method
use evaluation criteria from the intrinsic connections between features to score a feature subset correlation matrix (Pearson correlation)
correlation with output
correlation between input features distance metrics
Use interclass distance/intraclass distance mutual information
More general than correlation coefficient
quantifies the “the amount of information” obtained about one feature through the other feature consistency metrics
Chi-square: between feature and target. if features are independent to target are uninformative remove variables with low variance
result more general than wrapper method because it’s independent to model
Wrapper Method
filtering dataset using a machine learning model as evaluation criteria; Feed some features to ML models, evaluate performance and decide if add or remove the feature to imporve accuracy
Exhaustive search: numberate all possible combinations
RFE: input ML model and # desired features; use sklearn.feature_selection.RFE; combine with decision tree/random forest; find optimal combination
Heuristic search: sequential forward selection(SFS), sequential backward selection(SBS), greedy algorithms; bidirectional search use SFS and SBS
Forward selection:start from null model, then add features one by one; not guaranteed to give us the best model
Backrard selection: remove feature with the largest p-value Random search
SelectFromModel: sklearn method, can be used for all types of models; coef_ and
feature_importances_ attribute; less robust than RFE
more accurate than filtering but more computationally expensive
Embedded Method
examine the different training iterations of ML model and then rank the importance of each feature based on how much each of the features contributed to the model training
LASSO regularization (L1)
coefficients of features get shrunken if not positively contributing to model training features get automatically discarded by assigning coefficients = 0
use feature importance plot
Ridge with L2 penalty also works
Elastic Net:
incorporate penalities from L1 and L2 regularization;
learning a sparse model where few of the weights are non-zero like Lasso and on the other hand maintaining the regularisation properties of Ridge.
Tree-based algorithms
Feature selection vs. dimensinality reduction
Featue selection is simply selecting and excluding given features without changing them. Diemnsionality reduction transfroms features into a lower dimension.
Reference:
https://towardsdatascience.com/feature-selection-techniques-1bfab5fe0784; https://medium.com/@cxu24/common-methods-for-feature-selection-you-should-know-2346847fdf31; https://analyticsindiamag.com/what-are-feature-selection-techniques-in-machine-learning/
Data Preprocessing
Data cleaning
Check missing values
If small porition of missing value and the dataset is large, can simply drop them If not, impute missing values: mean, median, groupby
Check outliers
If you believe outliers might cause by data entry error, drop them
Data Transformation
Normalization/Standardization (for some models)
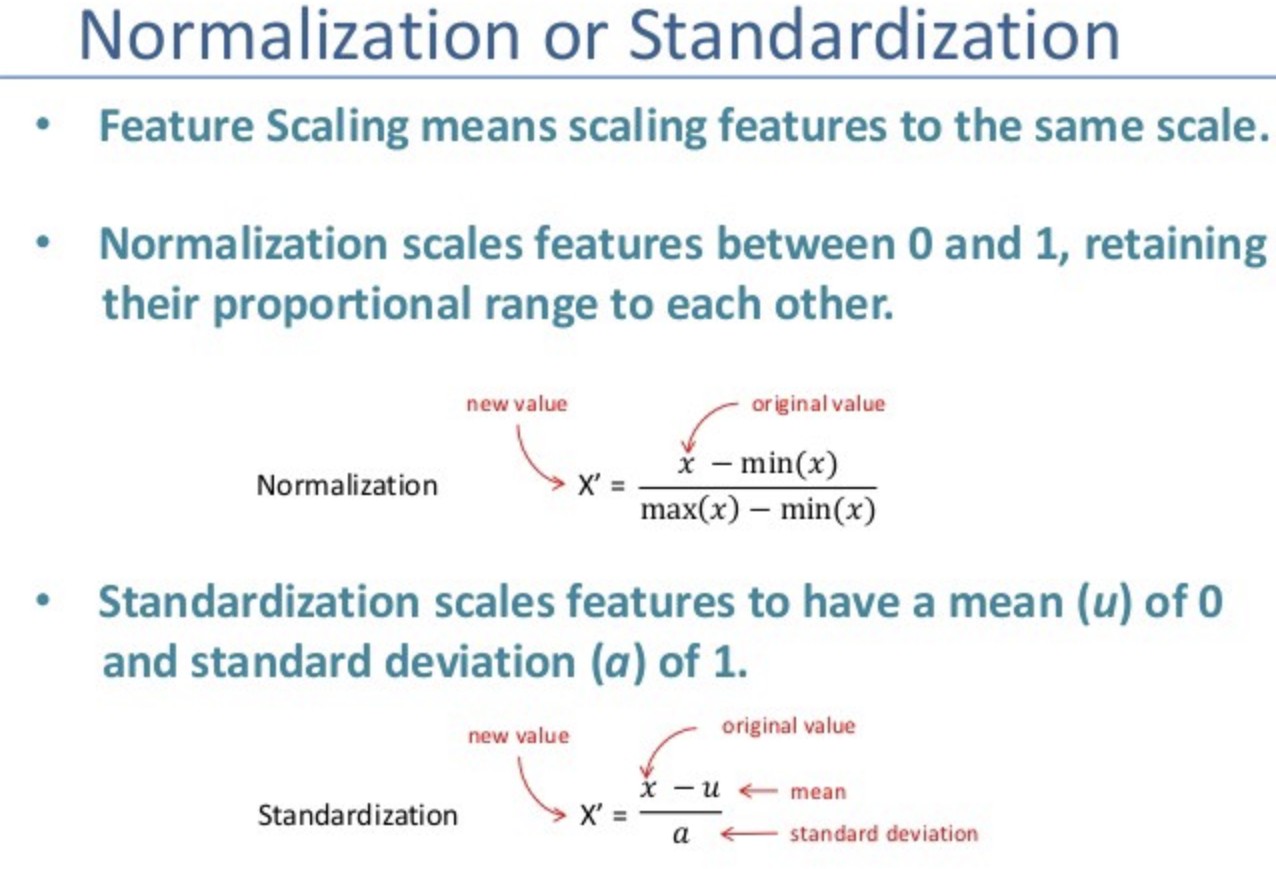
picture source: https://medium.com/datadriveninvestor/data-preprocessing-for-machine-learning-188e9eef1d2c
Encode categorical variable
Feature Selection or dimension reduction
Data normalization
can use box cox transformation to transform non-normal dependent variables into a normal shape.
Linear regression need normalize both input and output.
Actually, linear regression itself is insensitive to standardization, but in practice, we still want to normalize data because it can improves the numerical stability of your model
If not, converge will be slow. Because if two variables differ significantly in scale, we need different step size in two parameters. So we have to take extremely small steps that take a very long time to reach optimal value
If not, gradient descent might quick blowing up or run into underflow problem DT based algorithm: doesn’t matter
Distance-based algorithm: need standardize
Nerual network: can conteract standardization but in practice data standardization is beneficial in terms of accuracy
https://towardsdatascience.com/understand-data-normalization-in-machine-learning-8ff3062101f0
More features than more data points
overfitting
Least squares method can be unusable: no longer a unique least squares coefficient estimate
How to handle: regularization, use subeset of features, PCA reduce dimension, forward stepwise regression https://medium.com/@jennifer.zzz/more-features-than-data-points-in-linear-regression-5bcabba6883e
Encoding Categorical Features
Label Encoder
LabelEncoder converts each class under specified feature to a numerical value if multi-class, Label Encoder return different values for different categories
One Hot Encoder
For each class under a categorical feature, a new column is created for it. the output is a numpy array, not a dataframe
DictVectorizer
first transform dataframe to dict then use DictVectorizer return bumpy array
Get dummies
pd.get_dummies()
Notes: Represent categorical features as one-hot encoding introduce multicollinearity problem, which would harm linear regression model. Therefore, we use dummy encoding (drop one variable after one-hot encoding) in linear regression.
https://towardsdatascience.com/encoding-categorical-features-21a2651a065c https://towardsdatascience.com/one-hot-encoding-multicollinearity-and-the-dummy-variable-trap-b5840be3c41a
Feature Engineering
Use domain knowledge
Non linear features: polynomial, radial basis function, sigmoid, log
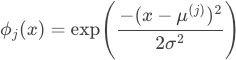 RBF:
RBF:
k-dimensional raw input, uniform grid with d centers over each dimension
generally local features: the value of any particular feature is close to zero for most of the input space, but non-zero in a small region around a “center” parameter.
Randomly chossing p data points or use k-means to find centers
use median trick to pick bandwidth , larger lead to smoother features functions, which in turns leads to smoother final functions
Kernel
motivation: need high dimensional representation but might be prohibitively expensive to compute Basic idea: rewrite the algorithm so thant we only work with dot product  of feature vectors; then replace the dot product with a kernel function
Can be applied to: perceptron, SVM, ridge regression, k-means, etc.
Neural network
Advanced modeling techniques
Recommender system
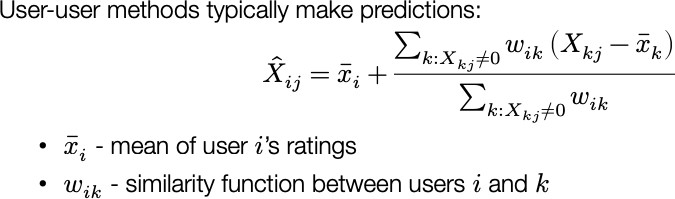
Basic idea: make recommendation based on the preferances that other users have indicated for these item (collaborative filtering, most of entries unknown)
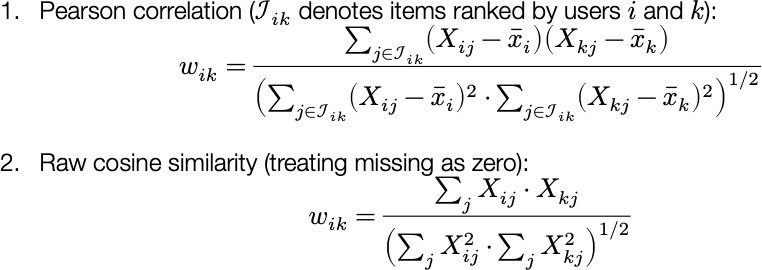
User-user/ item-item approaches: by correlation coefficient or cosine similarity
Similarity measures
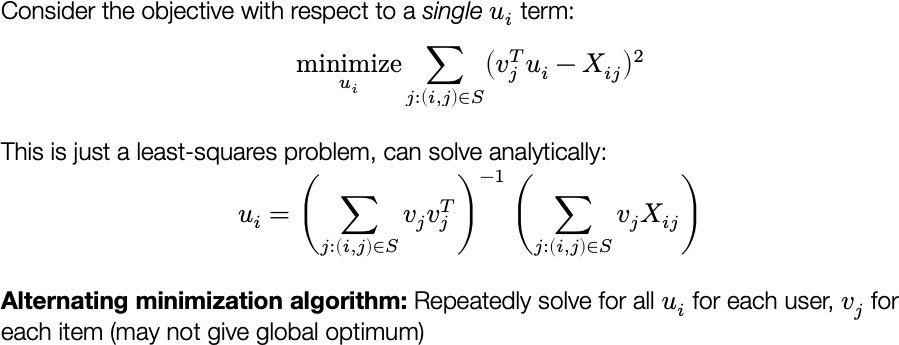
Matrix factorization: find some low-rank decomposition of the X matrix that agrees at abserved values Algorithm:
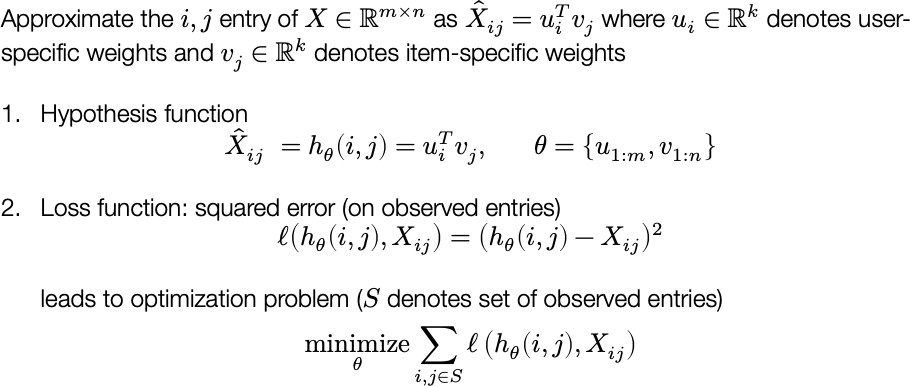
Optimization method:
All pictures of recommendation system come from CMU 15688 Practical Data Science Fall 2019 lecture notes
Anomaly detection
For supervised learning, anomalies are what some user labels as anomalies; for unsupervised view, anomalies are outliers (points of low probability) in the data
K-Means
The underline assumption in the clustering based anomaly detection is that if we cluster the data, normal data will belong to clusters while anomalies will not belong to any clusters or belong to small clusters.
outliers_fraction
use
our data set
Mixture Gaussian model
to provide information to the algorithm about the proportion of the outliers present in
Setting
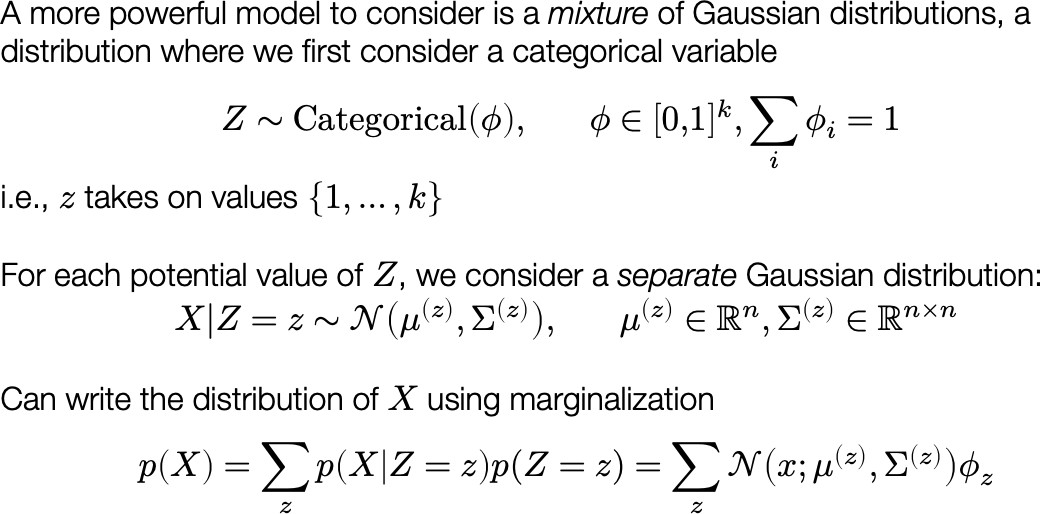
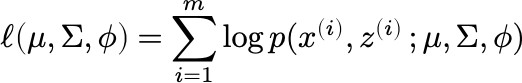 Loss:
Loss:
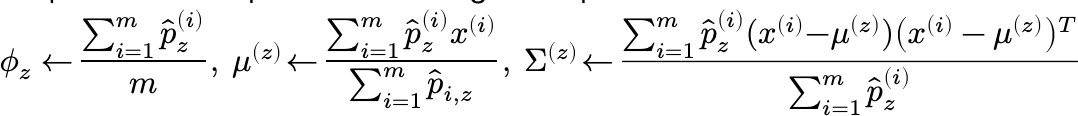
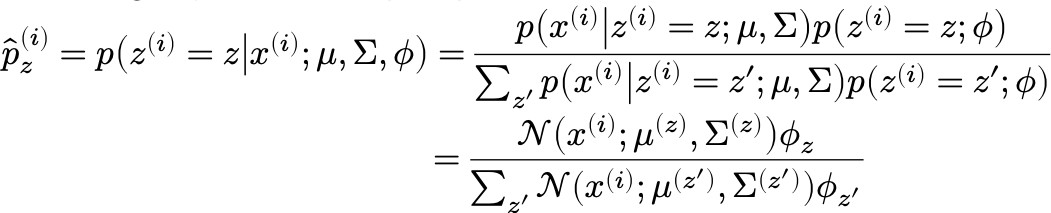 Optimizatio method: E(expection)M(maximization) E step:
M step:
Isolation Forest
detects anomalies purely based on the fact that anomalies are data points that are few and different
Isolation Forest algorithm isolates observations by randomly selecting a feature and then randomly selecting a split value between the maximum and minimum values of the selected feature. Here an anomalous point could be separated in a few steps while normal points which are closer could take significantly more steps to be segregated.
https://towardsdatascience.com/anomaly-detection-with-isolation-forest-visualization-23cd75c281e2